


Healthcare Quality Improvement Tools app for iPhone and iPad
Developer: MCS Media, Inc.
First release : 30 Nov 2016
App size: 29.64 Mb
Learn about and create common charts and graphs used in the continuous quality improvement process. This app will assist managers, team leaders, and continuous improvement specialists, etc. to gather and present data using the appropriate chart or graph to visually convey and support an improvement initiative (i.e., or Kaizen Event). This app, and the data charted, provides a method to easily share this information in the field, and is not meant to replace the data analysis and charting provided by other programs such as Excel.
This app is designed to:
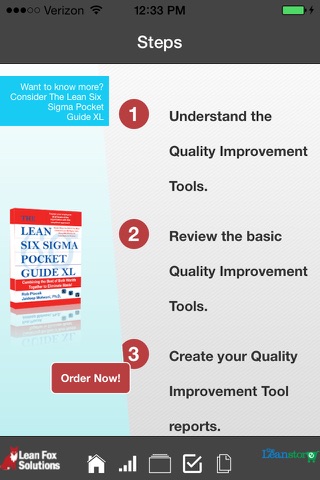
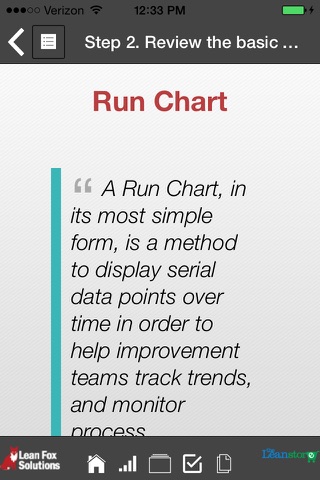
Convey the importance and practicality of the Quality Improvement Tools of Histogram, Pareto Chart, Run Chart, Scatter Plot, Fishbone (or Cause and Effect) Diagram, 5 Whys, Impact Map, and Stakeholder Analysis
Understand how to involve these tools in the continuous improvement process
Create customized current and future state charts and graphs, output it as a PDF or PNG, retrieve previous settings as needed
Record, assign, and track Action Items
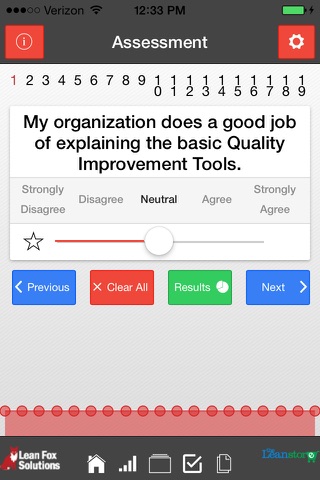
Create and conduct an assessment, output it as a pdf, along with guidance on how to improve assessment scores
Provide Sensei Tips and case studies as additional learnings
Provide access to the Excel Histogram, Pareto Chart, Run Chart, Scatter Plot, Fishbone (or Cause and Effect) Diagram, 5 Whys, Impact Map, and Stakeholder Analysis worksheets for customization
Create some interest or fun by providing a Lean Sigma puzzle
Look for more apps in our Practical Lean Six Sigma Series.